

Kildare shows the greatest growth of any county when it comes to house building with 236% rise
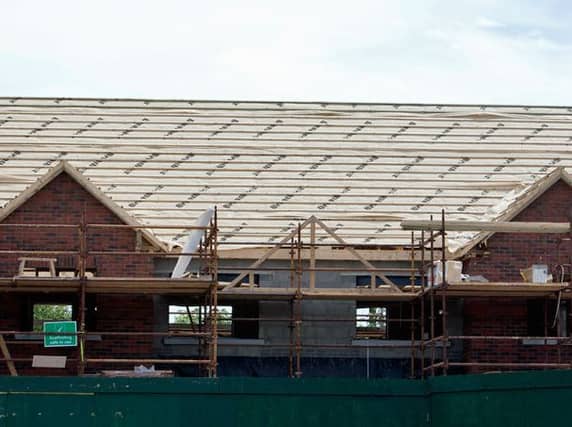

County Kildare has seen the largest rise in the level of house building during the first three months of 2017, with a massive increase of 236% in the level of building since last year.
It is part of an overall growth across the country as the government seeks to address the housing shortage, and further residential developments are being constructed all over Kildare at the moment.
According to CIF analysis of house building activity levels throughout Q1 2017, the rolling 12 month figure shows an increase of +37.6%% in terms of overall commencements for the 12 month period to the end of March 2017. The total commencement figure for 2016 was 13,234.
In total 3,860 residential units were commenced in the three-month period January to March 2017. These figures represent an increase of +33% (958 units) on the total number of units commenced during the same period in 2016.
Individual/One Off housing units represent just 26.7% of total commencements in the first 3 months of 2017, and increased by +33.7% on the same period in 2016.
Counties Kildare (+236%), Louth (+163.6%), Meath (+166.5%), Wexford (+172.7%), Dublin City (+49.3%), South County Dublin (+83.4%), Galway City and County (+2800% and +86.8%) showed some of the largest increases in overall commencement numbers.
In total 3,896 residential units were completed in the three-month period January to March 2017. With the rate of house completions in the first 3 months of the year representing a +23.9% increase in activity on the same period in 2016 and a +19% increase on the rolling 12 month period to the end of March 2017. The average monthly completion figure currently stands at 1,298 units.
The 3,896 residential units completed in first 3 months of 2017 can be broken down by type as follows:
- Individual/One Off Units: 1,543 units or 39.6%
- Scheme Units: 1,701 units or 43.7%
- Apartments: 652 units or 16.7%
In total 3,786 residential units were registered under the HomeBond house building insurance scheme in the 5 month period January to May 2017. The figures represent an increase of +67.7% (1,529 units) in developer led activity nationally on the same period in 2016. The majority of housing units registered were in Dublin (2,100 units), Meath (587 units), Kildare (255 units), Cork (225) Limerick (121) and Wicklow (119 units).
| TOTAL NUMBER OF RESIDENTIAL UNITS COMMENCED | ||||||||
| First 3 months: January - March 2017 | ||||||||
| Local Authority | Jan-Mar 2017 | Jan-Mar 2016 | Change | % Change | 12 mths to end Mar 2017 | 12 mths to end Mar 2016 | Change | % Change |
| Carlow County | 8 | 11 | -3 | -27.3% | 91 | 65 | 26 | 40.0% |
| Cavan County | 23 | 24 | -1 | -4.2% | 106 | 101 | 5 | 5.0% |
| Clare County | 51 | 46 | 5 | 10.9% | 205 | 137 | 68 | 49.6% |
| Cork City | 43 | 63 | -20 | -31.7% | 177 | 96 | 81 | 84.4% |
| Cork County | 265 | 204 | 61 | 29.9% | 1,391 | 851 | 540 | 63.5% |
| Donegal County | 63 | 72 | -9 | -12.5% | 301 | 236 | 65 | 27.5% |
| Dublin City | 563 | 377 | 186 | 49.3% | 1,805 | 1,124 | 681 | 60.6% |
| Dun-Laoghaire Rathdown | 180 | 628 | -448 | -71.3% | 816 | 1,397 | -581 | -41.6% |
| Fingal County | 401 | 372 | 29 | 7.8% | 1,721 | 1,950 | -229 | -11.7% |
| Galway City | 58 | 2 | 56 | 2800.0% | 157 | 41 | 116 | 282.9% |
| Galway County | 127 | 68 | 59 | 86.8% | 381 | 313 | 68 | 21.7% |
| Kerry County | 81 | 45 | 36 | 80.0% | 248 | 200 | 48 | 24.0% |
| Kildare County | 373 | 111 | 262 | 236.0% | 1,181 | 738 | 443 | 60.0% |
| Kilkenny County | 43 | 30 | 13 | 43.3% | 183 | 123 | 60 | 48.8% |
| Laois County | 35 | 45 | -10 | -22.2% | 172 | 134 | 38 | 28.4% |
| Leitrim County | 8 | 2 | 6 | 300.0% | 24 | 23 | 1 | 4.3% |
| Limerick City and County | 75 | 62 | 13 | 21.0% | 432 | 205 | 227 | 110.7% |
| Longford County | 9 | 10 | -1 | -10.0% | 51 | 23 | 28 | 121.7% |
| Louth County | 145 | 55 | 90 | 163.6% | 440 | 183 | 257 | 140.4% |
| Mayo County | 59 | 37 | 22 | 59.5% | 233 | 143 | 90 | 62.9% |
| Meath County | 421 | 158 | 263 | 166.5% | 1,291 | 492 | 799 | 162.4% |
| Monaghan County | 41 | 26 | 15 | 57.7% | 118 | 87 | 31 | 35.6% |
| Offaly County | 49 | 19 | 30 | 157.9% | 145 | 74 | 71 | 95.9% |
| Roscommon County | 20 | 11 | 9 | 81.8% | 88 | 52 | 36 | 69.2% |
| Sligo County | 48 | 13 | 35 | 269.2% | 112 | 47 | 65 | 138.3% |
| South Dublin County | 321 | 175 | 146 | 83.4% | 975 | 498 | 477 | 95.8% |
| Tipperary County | 31 | 28 | 3 | 10.7% | 136 | 106 | 30 | 28.3% |
| Waterford City and County | 61 | 35 | 26 | 74.3% | 249 | 164 | 85 | 51.8% |
| Westmeath County | 30 | 15 | 15 | 100.0% | 88 | 67 | 21 | 31.3% |
| Wexford County | 90 | 33 | 57 | 172.7% | 336 | 200 | 136 | 68.0% |
| Wicklow County | 138 | 125 | 13 | 10.4% | 539 | 442 | 97 | 21.9% |
| TOTALS: | 3,860 | 2,902 | 958 | 33.0% | 14,192 | 10,312 | 3,880 | 37.6% |
| Dublin Local Authorities | 1,465 | 1,552 | -87 | -5.6% | 5,317 | 4,969 | 348 | 7.0% |
| GDA - Greater Dublin Area | 2,397 | 1,946 | 451 | 23.2% | 8,328 | 6,641 | 1,687 | 25.4% |